Executive summary
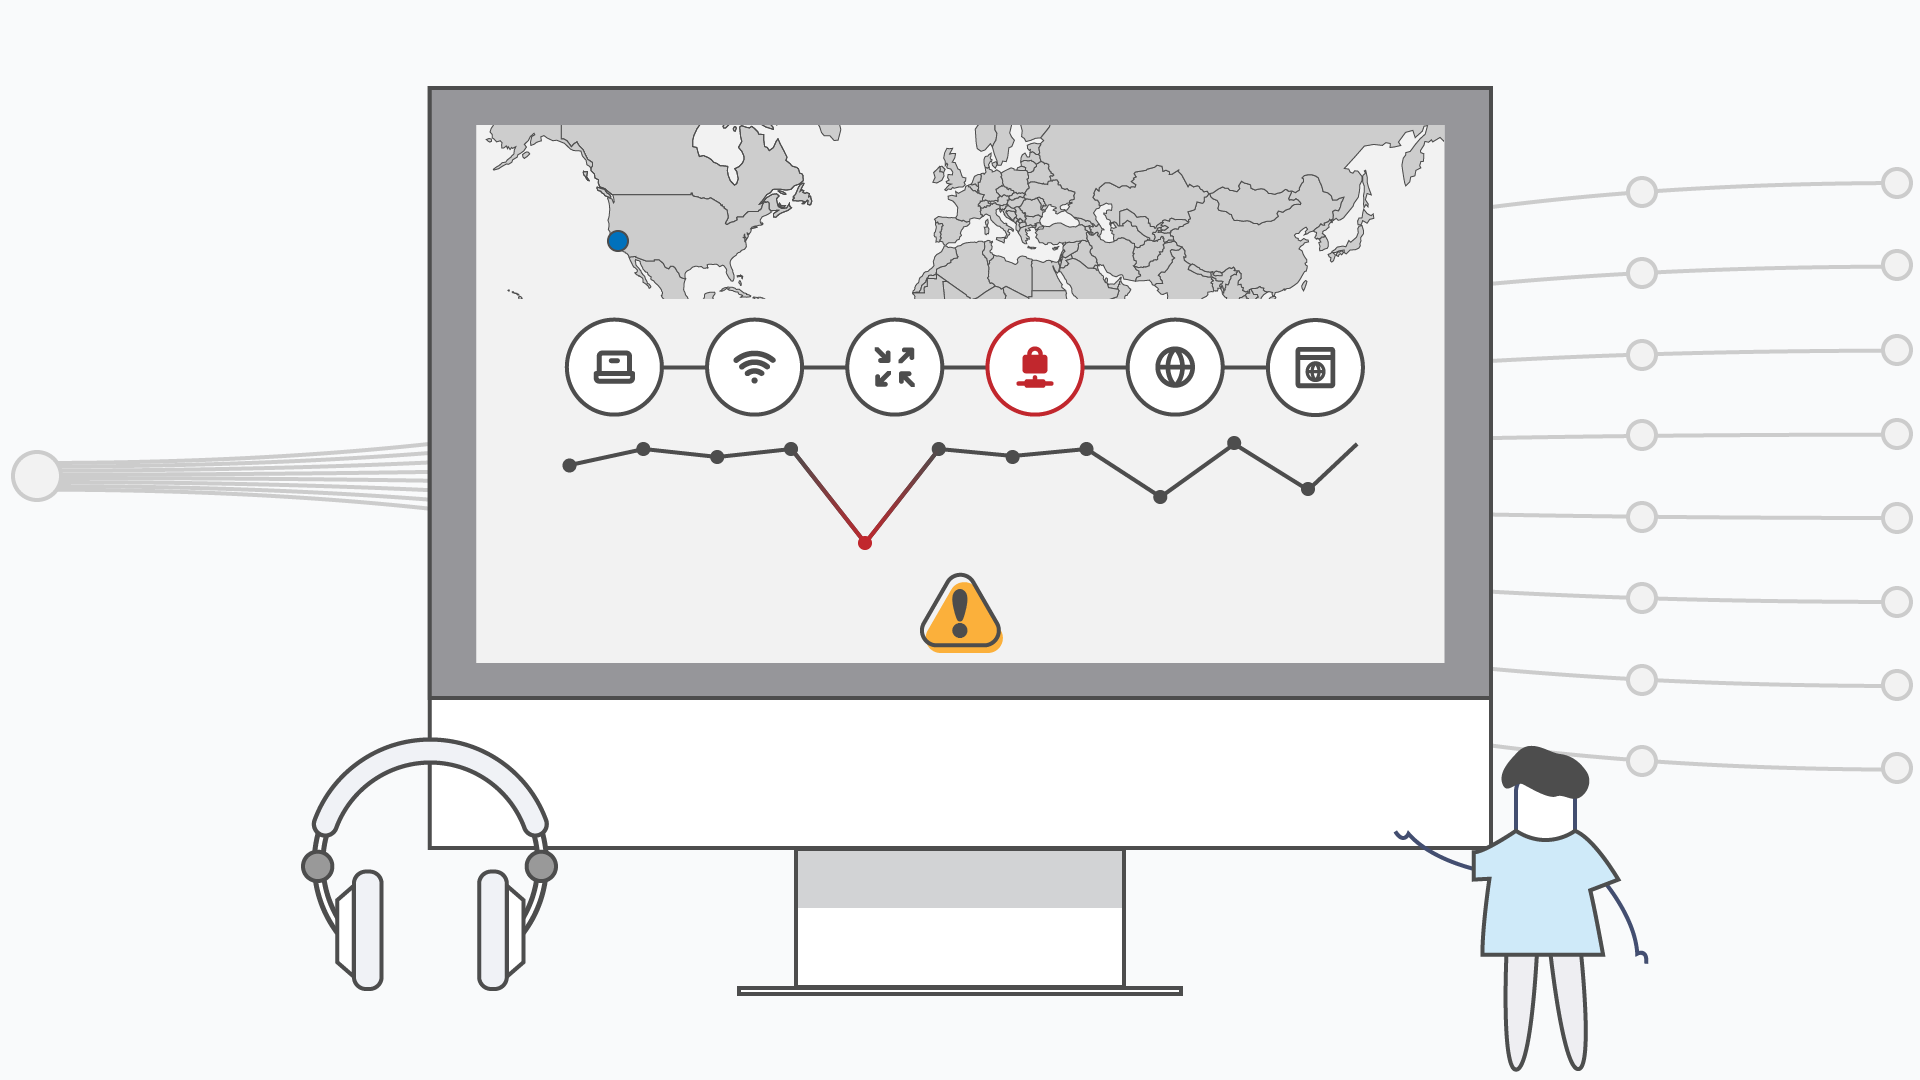
I designed the Single Agent View for End-User Monitoring: a dedicated troubleshooting experience for Tier 1 and Tier 2 IT teams investigating an individual employee’s connection problem.
Instead of asking support teams to infer a person’s experience from aggregate test data, the experience creates an agent-level lens across local network conditions, application performance, and the next best place to investigate.
The challenge
In the shift to widespread remote work after the pandemic, IT teams were suddenly supporting employees across far more variable home-network conditions. Customer feedback made a consistent gap clear: Endpoint Agent lacked a dedicated lens for understanding one person’s experience.
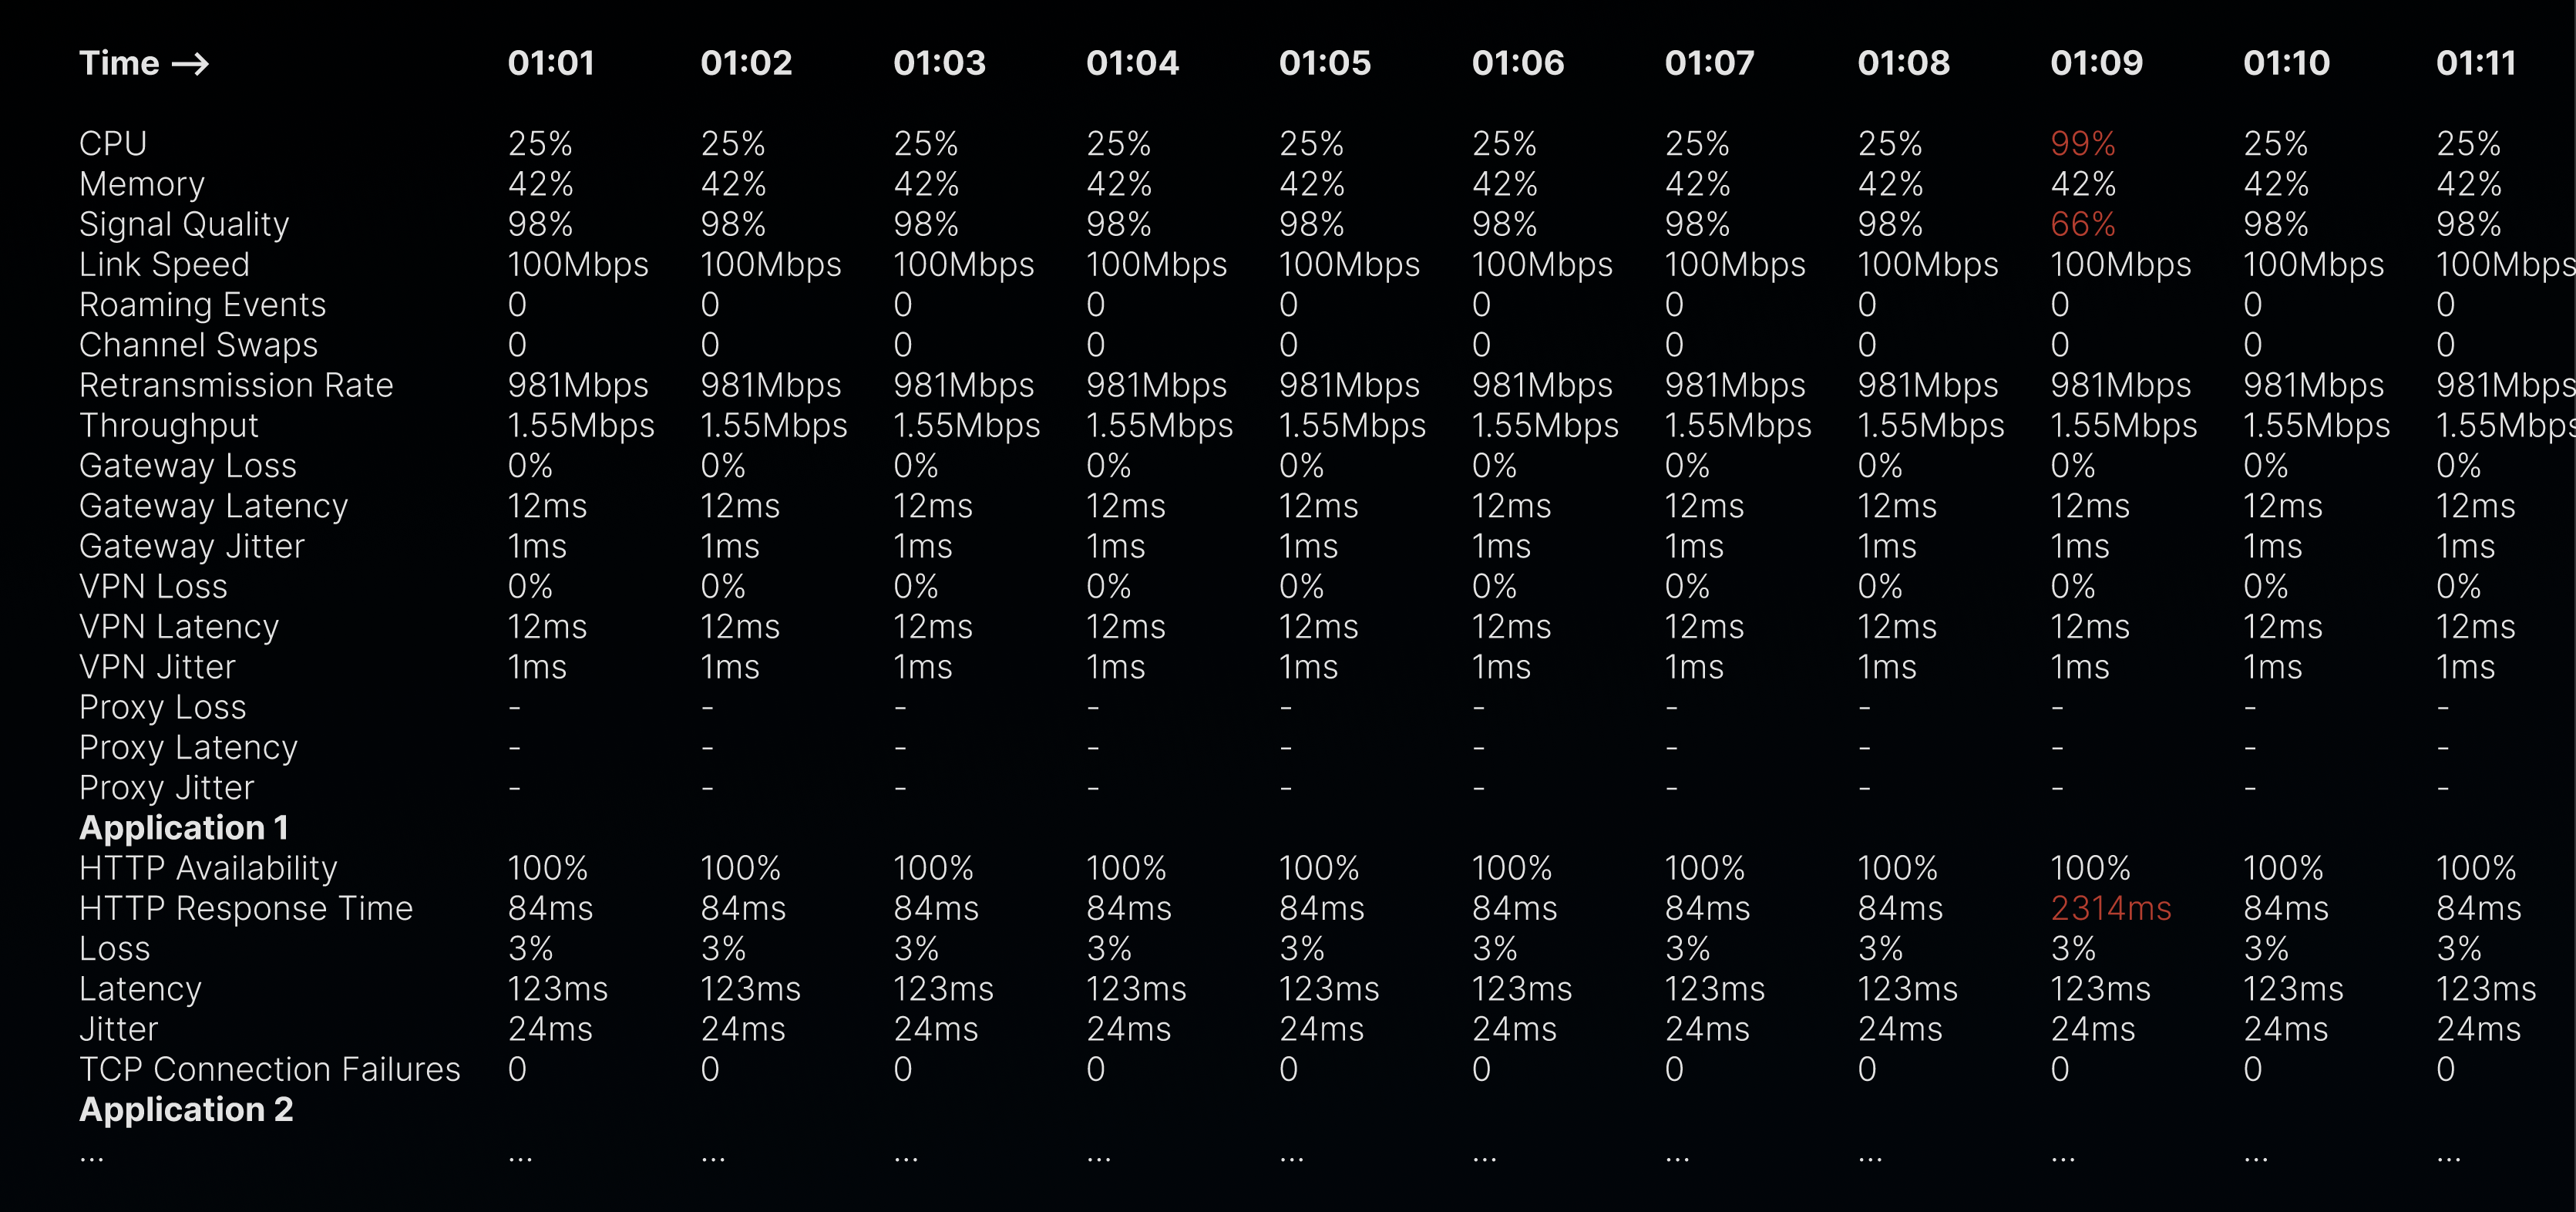
Existing scheduled tests provided an aggregated view of a group of endpoint agents testing a single application. This was useful for identifying broad issues, but it did not explain why one employee might be having a poor experience.
Each endpoint agent can have different local network conditions and different performance outcomes across applications. Helpdesk teams needed a way to move from a reported employee issue to relevant, agent-level network and application insights.
Role & strategy
My role
I led the design initiative for the Single Agent View. I convened a cross-functional workshop with customer success, product management, and internal partners to align on how Endpoint Agent Overview needed to evolve, then established the troubleshooting model and made it actionable across a range of customer maturity levels.
- Defined the agent-level information architecture and end-to-end interaction model
- Applied progressive disclosure to support rapid triage and deeper diagnostics
- Validated concepts with customers, usability testing, and engineering constraints
- Explored how AI summaries could accelerate the troubleshooting workflow
The strategic bet
Rather than extend an aggregate overview with more telemetry, I made the strategic call to establish a dedicated single-agent lens. The design challenge was not “show more endpoint data.” It was to help a helpdesk professional construct a defensible explanation under pressure: identify the employee, assess their environment, connect signals across applications, and narrow the next investigation.
Reported issue
Start with the employee and their symptom.
Local context
Assess the agent’s network and endpoint conditions.
Connected signals
Compare experience across relevant applications.
Focused action
Escalate with evidence, not a vague symptom.
Selected decisions
Over four major iterations, the question stayed consistent: how do we surface the signal that matters without losing the diagnostic evidence a technician needs? Each release addressed the limit of the previous model.
Stacked metric swimlanes
Established a single-agent view, but required too much scanning to understand whether something was wrong.
Aggregated line charts
Created room for segment visualizations—critical for identifying which network segment contained the problem.
Time-based heatmaps
Added horizontal issue signaling across time, linking a meaningful timestamp to the metrics worth investigating.
Progressive disclosure
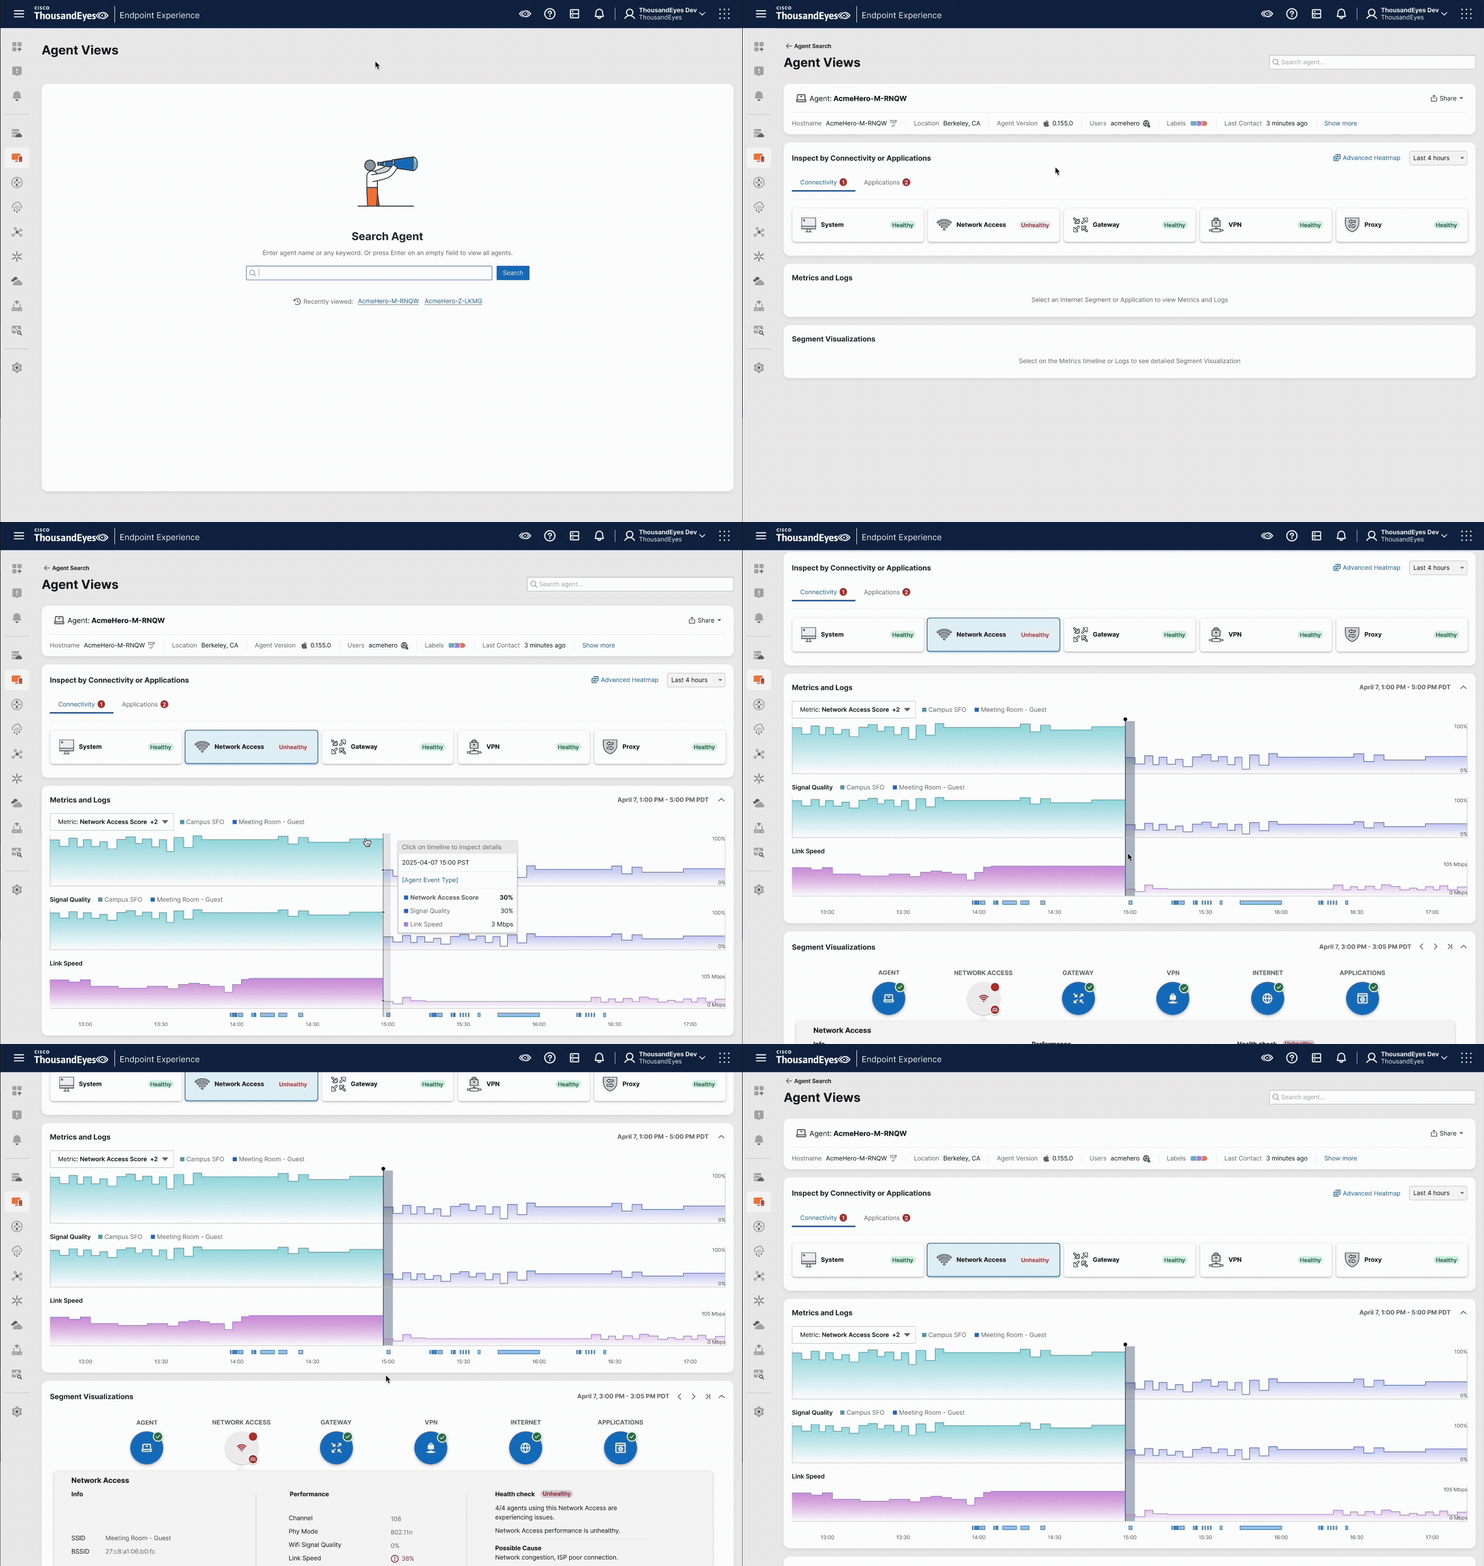
Reduced noise when customers monitored dozens of applications: surface the issue first, then reveal the relevant time and metrics.
Looking ahead: AI-assisted triage
I also explored an AI summary concept to help technicians orient to a complex issue more quickly. This was an exploratory direction and is not represented in the shipped mock.
The solution
The Single Agent View brings agent-specific conditions and application performance into one investigation surface, helping support teams move from a reported connection issue to focused next steps.
Outcomes & reflection
The experience established a dedicated agent-level troubleshooting workflow where teams previously had to work backward from aggregate results.
*Excludes seasonal holiday periods.
Leadership reflection: The heatmap tested well when the mockup showed only a few applications, but that scenario did not represent the scale of a real customer environment—where an organization might monitor as many as 50 apps. I learned to validate information density and scanability at realistic scale, not just the interaction model in isolation. That lesson led directly to progressive disclosure: show the issue signal first, then reveal the time and metrics needed to investigate it.